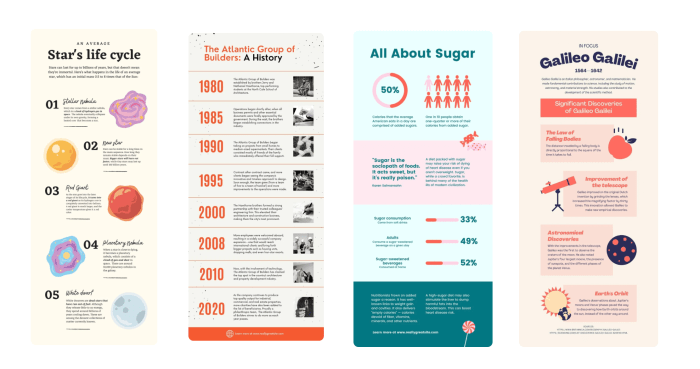
Creating Interactive Infographics dives into the world of visual storytelling with a modern twist, exploring how to captivate audiences through dynamic data representation. From interactive charts to engaging animations, this guide unveils the secrets to crafting compelling infographics that leave a lasting impact.
Benefits of Interactive Infographics: Creating Interactive Infographics
Interactive infographics offer a dynamic way to present information, allowing users to engage with the content in a more immersive and personalized manner. Unlike static infographics, interactive ones provide a richer experience and can lead to higher user engagement.
Enhanced User Engagement
Interactive infographics can include features such as clickable elements, animations, quizzes, and more, making the content more interactive and engaging for users. For example, a clickable map that allows users to explore different regions for specific data points can keep users interested and encourage them to spend more time on the infographic.
Better Conveyance of Complex Information
Complex information can be difficult to understand in a static format. Interactive infographics, on the other hand, can use interactive elements like sliders, timelines, and pop-up boxes to break down complex data into digestible chunks. This can help users grasp the information more easily and retain it better.
Elements of Interactive Infographics

Creating an interactive infographic involves several key components that work together to engage the audience and convey information effectively. Incorporating animations, interactive charts, and graphs are essential elements that make the infographic more engaging and informative.
Animations in Interactive Infographics
Animations can be used to add movement and visual interest to the infographic, making it more engaging for the viewers. By incorporating animations such as transitions, fade-ins, or interactive elements like hover effects, the infographic becomes more dynamic and captures the attention of the audience effectively.
Interactive Charts and Graphs
Interactive charts and graphs play a crucial role in conveying data effectively in an infographic. By allowing users to interact with the data through features like tooltips, zoom functionalities, or filtering options, the information becomes more accessible and easier to understand. Interactive charts and graphs enable users to explore the data further, leading to a more engaging and informative experience.
Tools for Creating Interactive Infographics

Creating interactive infographics requires the right tools to bring your data to life and engage your audience effectively. Let’s explore some popular tools and software used for designing interactive infographics.
1. Adobe Illustrator
Adobe Illustrator is a versatile tool that many designers use to create stunning visuals, including interactive infographics. It offers a wide range of features for designing and editing graphics, making it a popular choice for professionals.
2. Canva
Canva is a user-friendly online design tool that allows users to create various graphics, including interactive infographics, with ease. It offers a drag-and-drop interface, a wide selection of templates, and customization options suitable for beginners and experienced designers alike.
3. Piktochart
Piktochart is another online tool specifically designed for creating infographics. It provides a library of customizable templates, icons, and charts to help users design engaging and informative interactive infographics without the need for advanced design skills.
4. Tableau
Tableau is a powerful data visualization tool that enables users to create interactive dashboards and infographics. It allows for the integration of various data sources, making it ideal for projects that require in-depth data analysis and visualization.
Choosing the right tool for creating interactive infographics depends on the project requirements, your design proficiency, and budget constraints. Consider factors such as ease of use, available features, customization options, and compatibility with your data sources when selecting a tool for your next infographic project.
Design Tips for Interactive Infographics
When it comes to designing interactive infographics, it’s crucial to create a visually appealing layout that captures the audience’s attention while effectively conveying information. Balancing text and interactive elements is key to keeping users engaged and ensuring a seamless navigation experience.
Visual Hierarchy is Key
One of the most important design tips for interactive infographics is to establish a clear visual hierarchy. This means using different font sizes, colors, and styles to prioritize information and guide the user’s attention. Make sure to highlight key data points and use visual cues to differentiate between sections.
Keep it Simple and Clean
Avoid cluttering your infographic with excessive text or graphics. Keep the design clean and minimalist to prevent overwhelming the viewer. Use white space effectively to create breathing room and enhance readability. Remember, less is often more when it comes to design.
Use Consistent Branding, Creating Interactive Infographics
Maintaining consistent branding throughout your interactive infographic is essential for building brand recognition and credibility. Use your brand colors, fonts, and imagery to create a cohesive look that aligns with your brand identity. This helps users associate the infographic with your brand.
Mobile-Friendly Design
In today’s mobile-centric world, it’s crucial to ensure that your interactive infographic is optimized for mobile devices. Make sure that the design is responsive and adapts to different screen sizes. Test the infographic on various devices to ensure a seamless user experience across platforms.
Intuitive Navigation
Provide clear navigation cues and interactive elements that guide users through the infographic. Use clickable buttons, scrollable sections, and other interactive features to enhance user engagement. Make sure that users can easily navigate through the content without getting lost.
Engage with Multimedia
Incorporating multimedia elements like videos, animations, and interactive charts can enhance the overall user experience of your interactive infographic. These elements can make the content more engaging and help convey complex information in a digestible format. Just make sure they enhance the user experience rather than distract from the main message.


